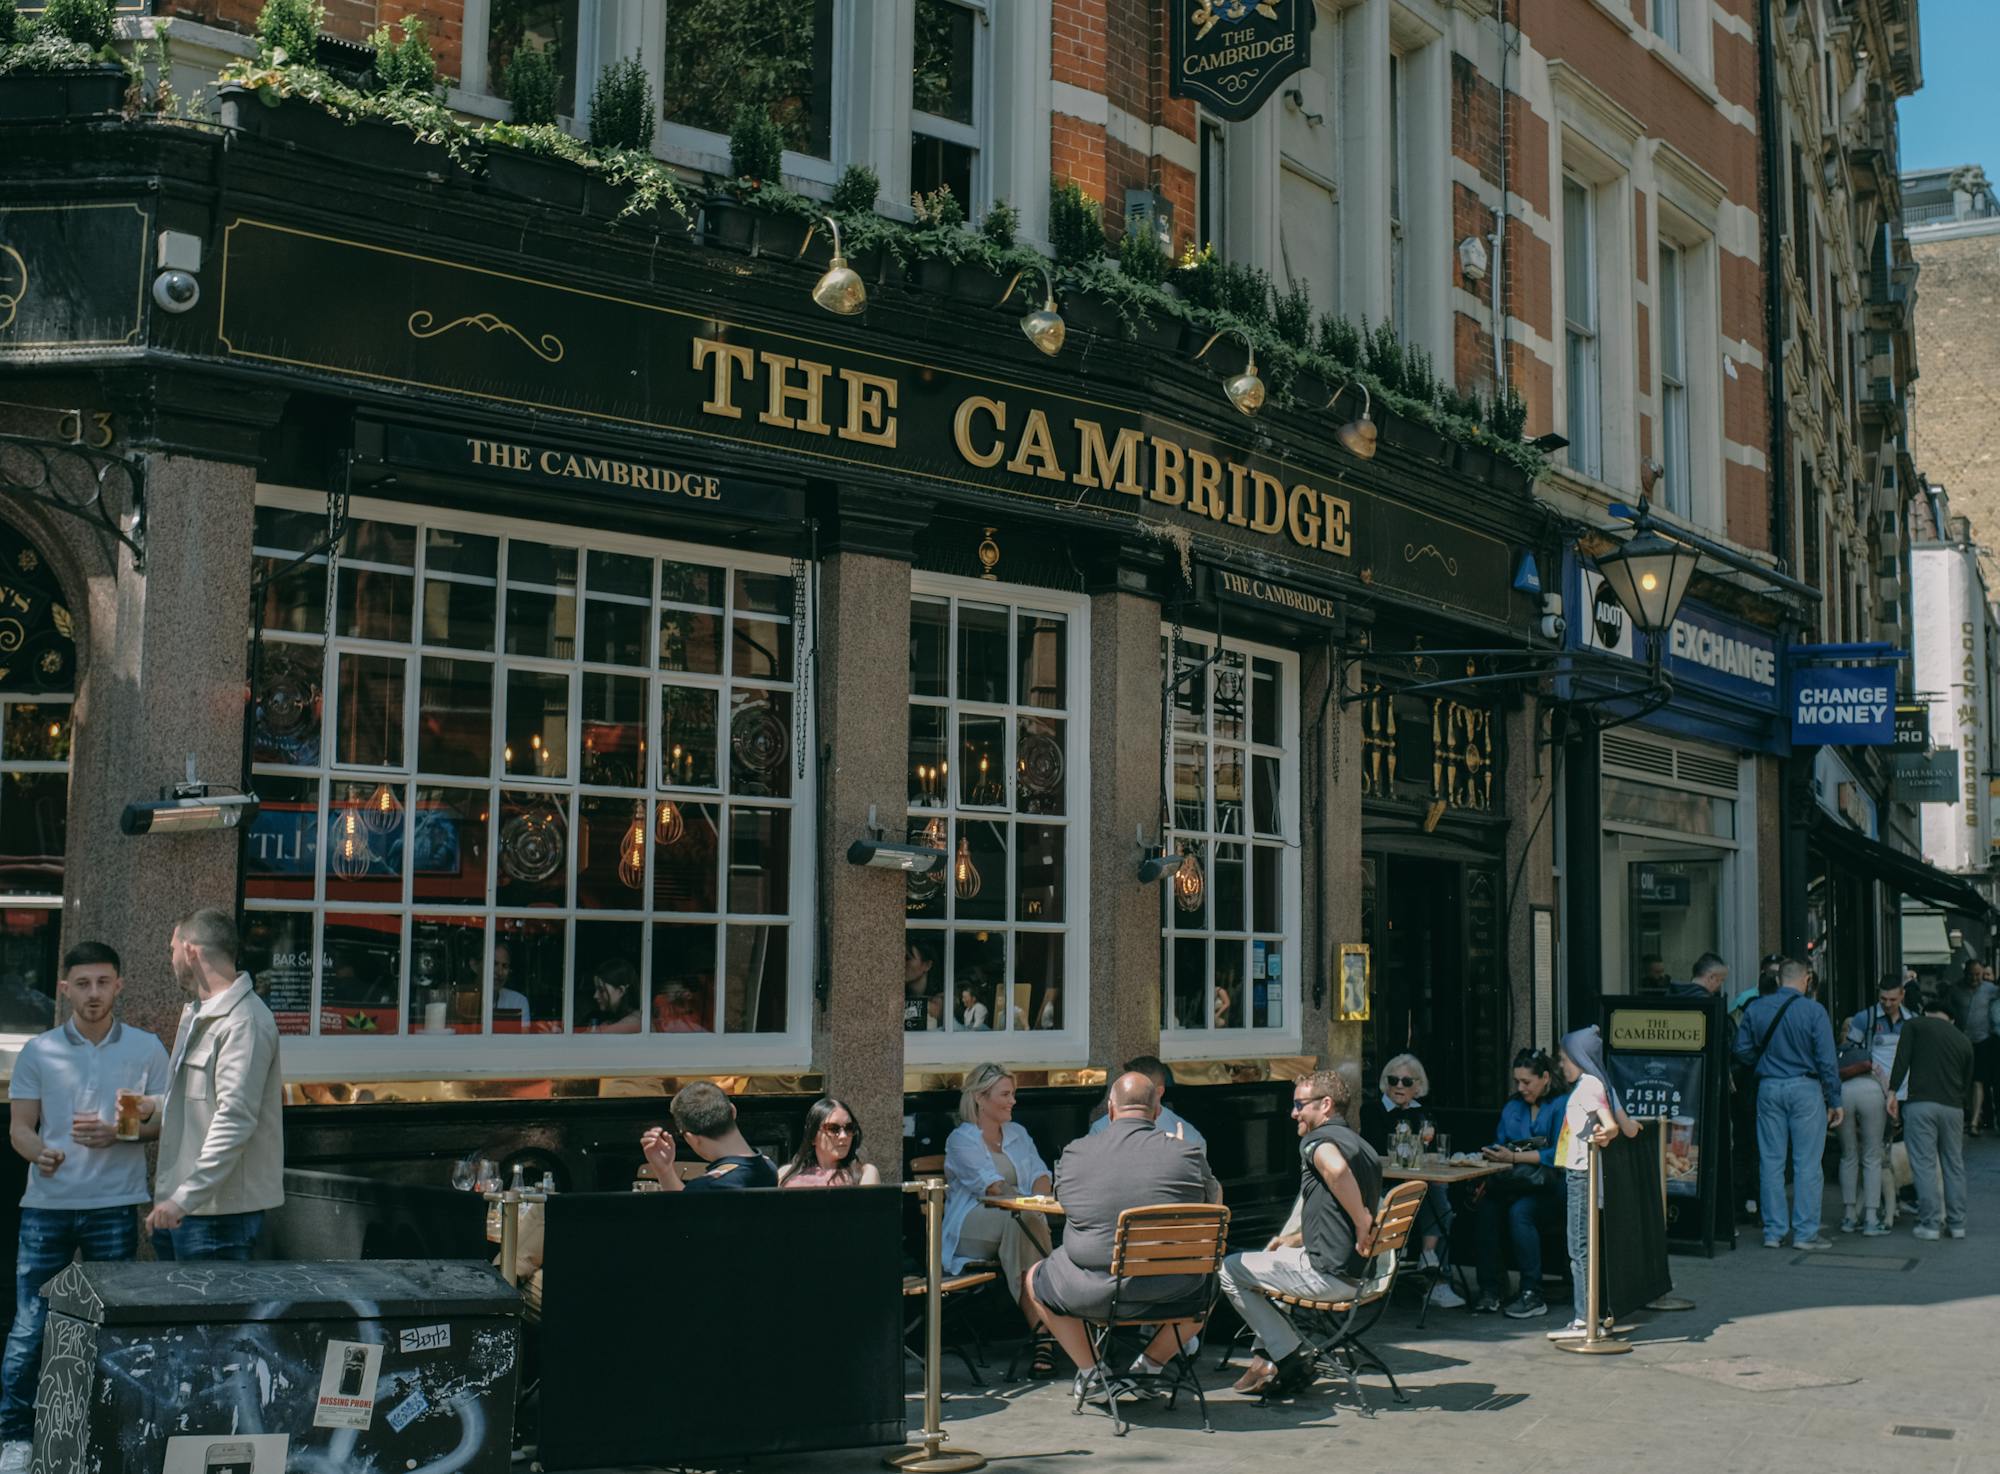
The 80/20 Report: What 884 UK Pub Audits Reveal About Digital Health Across 23 Brewery Estates
By Tom Fairhall | Pub Post Pro | April 2026Across 884 pubs audited in 23 independent brewery estates, the average digital health score is just 53 out of 100, just over half marks. Not a single pub out of 884 scored in Band A (Thriving). Zero. The highest-scoring pub in the entire dataset scored 76 out of 100, and it was the only one to break 70.
The data does not reveal a struggling industry fighting heroically to be seen. It reveals an industry that has collectively decided, without quite meaning to, that mediocre is fine.
This is the 80/20 Report. The title is deliberate. We found that 80% of the problem (the gap between where estate pubs are digitally and where they could be) comes from just two of the seven pillars we measured: Engagement and Content. These are the cheapest pillars to fix, the ones requiring the least infrastructure investment, and the ones where the entire industry is uniformly, remarkably bad.
Fix those two, and you don't just improve your score. You separate your estate from every competitor in the country.
We built this report for brewery marketing directors, trade press, and anyone who wants to understand the real state of the independent brewery estate digital landscape in 2026. The findings are not flattering. They are, however, actionable.
What We Did
The Audit
Between January and April 2026, we audited 884 pubs across 23 independently-owned UK brewery estates. The estates range from Shepherd Neame in Kent (England's oldest brewer, with 320 pubs) to Donnington Brewery in the Gloucestershire Cotswolds, with 15. Together, these 23 estates operate over 2,500 tied and tenanted pubs across England, Wales, and the Isle of Man.
Our audit covered roughly 34.8% of the estates' combined pub portfolio. Selection was based on publicly listed estate pubs, with coverage varying by estate size and data availability. For a handful of smaller estates, we captured close to 100% of the estate; for the largest, we sampled proportionally.
All data was collected from publicly available sources: Google Business profiles, Facebook business pages, Instagram accounts, pub websites, and other accessible digital touchpoints. No brewery was contacted in advance of the audit. We scored what anyone with a smartphone could find.
The Scoring System
We score each pub across seven pillars. Six are worth a maximum of 15 points and Content Quality a maximum of 10, giving a maximum possible total of 100. The pillars are:
Reputation: Google star rating. A high average rating scores well; below 4.0 scores poorly. This measures what customers think of you. Volume: Total number of Google reviews. More reviews means higher local search visibility and greater social proof. This measures how many customers have bothered to say something. Presence: The range of social and digital profiles a pub maintains: Google Business, Facebook, Instagram, a website. This measures whether you have built a digital footprint. Engagement: Posting frequency on social media. A pub that posts regularly scores well; a pub that hasn't posted in months scores near zero. This measures whether you use your digital footprint. Website: Quality, speed, and completeness of the pub's own website or dedicated web page. Responsive: Whether the pub's web presence is properly optimised for mobile browsers, the primary device used by people searching for pubs. Content: Whether the pub publishes blog posts, regular updates, menus, and fresh written content. This measures whether you give search engines and customers something to read.The seven pillars add to a maximum of 100. Scores fall into five bands:
| Band | Label | Score Range |
|---|---|---|
| A | Thriving | 80-100 |
| B | Stable | 60-79 |
| C | At Risk | 40-59 |
| D | Critical | 20-39 |
| F | Invisible | 0-19 |
The bands are intentionally demanding. A score of 60 (the bottom of Band B) represents a pub with a strong Google presence, solid review volume, active social profiles, and regular posting. In 2026, that should be a minimum expectation. The data tells us it is, in practice, an exceptional achievement.
Finding 1: The Mediocre Middle
An entire industry packed into a 20-point band
Here is the headline finding, stated plainly: 93.2% of pubs, 824 out of 884, score in Band C (At Risk), clustered between 40 and 59 points. The bottom 6% are in Band D or F. And the Band B count? Seven pubs. Out of 884. All from the same estate.
The data shows an industry stuck in mediocrity: 93% of pubs score within the same narrow 20-point band.
This is not a distribution that shows leaders, middle performers, and laggards. It is a distribution that shows almost everyone compressed into a single category, with a small outlier cluster at the bottom. There are no leaders. The entire industry is the middle.
The gap between the top-ranked estate, Adnams, and the bottom-ranked, Harvey's, is only 13.3 points. Adnams averages 56.2 out of 100. Harvey's averages 42.9. These are the two extremes of a 23-estate industry, and the distance between them is smaller than the gap between a Band C and a Band B pub.
Even the best-performing estate averages only 53% of the maximum possible score. No estate averages above 57. The ceiling is remarkably low across the entire industry.
The Band B anomaly
Those seven Band B pubs deserve attention, because they tell us two things simultaneously.
First, they belong entirely to Harvey's Brewery in Sussex. Harvey's is the only estate with any Band B pubs, yet it also has the most Band D pubs (20) and the highest standard deviation (14.2), revealing extreme inconsistency. Remove Harvey's 7 Band B pubs from the dataset and the remaining 877 pubs contain zero pubs scoring above 59.
Second, and more importantly: those seven pubs prove that Band B is achievable within a tied estate context. The highest-scoring pub in the dataset, the Royal Oak in Southwark, scored 76 out of 100. That pub demonstrates exactly what is possible. It is not an outlier because of some unique structural advantage. It is an outlier because someone has been making the effort.
The rest of the industry could follow. Almost none of it has.
The estate ranking
Here is where every estate sits, ranked by average score:
| Rank | Estate | Region | Pubs Audited | Avg Score |
|---|---|---|---|---|
| 1 | Adnams | Suffolk & East Anglia | 42 | 56.2 |
| 2 | Robinsons | Cheshire, Manchester, Derbyshire & N Wales | 50 | 56.0 |
| 3 | Shepherd Neame | Kent & South East England | 50 | 56.0 |
| 4 | Hook Norton | Oxfordshire & Cotswolds | 31 | 55.9 |
| 5 | Liberation / Butcombe | South West England & Channel Islands | 50 | 55.7 |
| 6 | Everards | East Midlands & Leicestershire | 22 | 55.6 |
| 7 | Hall & Woodhouse | Dorset, Hampshire, Wiltshire & Surrey | 50 | 55.5 |
| 8 | Donnington | Gloucestershire & Cotswolds | 20 | 55.1 |
| 9 | Palmers | Dorset & West Country | 38 | 54.8 |
| 10 | Timothy Taylor | West Yorkshire | 29 | 54.7 |
| 11 | McMullen's | Hertfordshire & North London | 50 | 54.5 |
| 12 | Wadworth | Wiltshire, Oxfordshire & Hampshire | 50 | 54.5 |
| 13 | St Austell | Cornwall, Devon, Somerset & South Wales | 37 | 54.3 |
| 14 | Theakston | North Yorkshire | 3 | 52.7 |
| 15 | JW Lees | Manchester & Lancashire | 50 | 52.6 |
| 16 | Joseph Holt | Greater Manchester | 40 | 52.5 |
| 17 | Thwaites | Lancashire & North West England | 50 | 52.5 |
| 18 | Felinfoel | West Wales | 50 | 51.7 |
| 19 | Arkell's | Swindon, Wiltshire & Gloucestershire | 31 | 51.3 |
| 20 | Batemans | Lincolnshire & East Midlands | 35 | 51.3 |
| 21 | Hydes | Manchester, Salford & Cheshire | 33 | 50.2 |
| 22 | Okell's | Isle of Man | 29 | 46.6 |
| 23 | Harvey's | Sussex, Kent, Surrey & London | 44 | 42.9 |
The table confirms the compression. Thirteen of the top twenty estates sit within a 4-point band (52.5 to 56.2). Scale offers no advantage: Robinsons and Shepherd Neame tie at 56.0 despite Shepherd Neame having 320 pubs to Robinsons' 250. Having a large estate does not make you better at digital.
Finding 2: The Review Power Law
How a handful of pubs dominate Google visibility
The second finding is about review volume: how it creates a power law within and across estates.
The volume pillar measures how many Google reviews a pub has accumulated. We scored it on a tiered scale, with a maximum of 13 points (the rubric does not use 14 or 15 for this pillar). The distribution tells a striking story.
54.2% of pubs (479 out of 884) score the maximum 13 on volume: they have accumulated enough reviews to earn full marks on our scale. But this masks an enormous range. A pub with 100 reviews and a pub with 2,000 reviews both score 13. In raw terms, those pubs are not equivalent: the one with 2,000 reviews has dramatically higher Google visibility, greater credibility with first-time visitors, and a substantially larger data set of customer sentiment.
The scoring rubric compresses the difference; real-world search results do not.
At the other end: 5 pubs have zero reviews. They are invisible to anyone searching Google. A pub with no reviews does not show up prominently in local search results, does not trigger Google's "people also viewed" suggestions, and gives customers no social proof at all. For a business that depends on footfall, that is an extraordinary vulnerability.
The bimodal gap
The distribution is bimodal. Pubs either have lots of reviews (scoring 10-13, accounting for 79.1% of the dataset) or very few (scoring 0-5, accounting for 9.3%), with a gap in the middle.
| Volume Score | Pubs | Estimated Review Range |
|---|---|---|
| 13 | 479 (54.2%) | 100+ reviews |
| 10 | 220 (24.9%) | 50-99 reviews |
| 7 | 103 (11.7%) | 20-49 reviews |
| 5 | 33 (3.7%) | 10-19 reviews |
| 0-4 | 49 (5.5%) | 0-9 reviews |
Note that scores 6, 8, 9, 11, 12, 14, and 15 have zero pubs. The scoring rubric creates discrete tiers rather than a continuous scale, which means the apparent bimodal distribution reflects the structure of the scoring as much as the underlying review distribution. The real concentration of reviews is even more extreme: in raw terms, the bottom 50% of pubs by volume likely account for less than 10% of actual reviews left.
The review economy follows a power law: a handful of pubs dominate Google search results while hundreds languish with thin review profiles. This matters for estates, not just individual pubs. When a customer searches for a pub in a town where an estate has three or four tied houses, the one with the most reviews appears first.
It captures the casual foot traffic. The others are sorted below it, not because they are worse pubs, but because they have accumulated less digital testimony.
What the power law means for brewery estates
There is an important practical implication here for any estate considering a coordinated digital strategy. Because the review volume distribution is so skewed (54% of pubs are already at the maximum scoring tier), the marginal value of increasing reviews is concentrated in the bottom 46%.
The pubs with 20 or fewer reviews can, with relatively modest effort, move from near-invisible to moderately visible. They need perhaps 30-50 new reviews to change their search ranking materially.
For the pubs already in the 100+ category, the priority is different: it is about maintaining and building on an existing advantage, not catching up from nothing.
The 5 pubs with zero reviews are a separate concern entirely. They are, in the language of digital marketing, dead on Google. That is fixable. But it requires someone to notice, and someone to act.
Finding 3: Reputation Is a Ceiling, Not a Differentiator
When everyone is four stars, four stars means nothing
The reputation pillar measures Google star ratings. And here the data tells a story that is almost the opposite of what you might expect.
81.3% of pubs score 12 or 13 on reputation: they have a rating somewhere between 4.0 and 4.8 stars on Google. Reputation is the great equaliser: almost every pub has a rating between 4.0 and 4.8 stars. Only 5 pubs (0.6%) score zero on reputation, matching the 5 with zero reviews, the same pubs, absent from Google entirely.
This uniformity is striking. In almost every other industry, quality ratings cluster around a normal distribution. Some businesses score very low, most cluster in the middle, a few reach the top. Pub Google ratings do not do this. They pile up at the high end, creating a wall of four-star venues with almost no meaningful differentiation between them.
| Reputation Score | Count | % |
|---|---|---|
| 13 (best) | 407 | 46.0% |
| 12 | 312 | 35.3% |
| 10 | 126 | 14.3% |
| 8 | 18 | 2.0% |
| 7 | 8 | 0.9% |
| 5 or below | 11 | 1.2% |
| 0 | 5 | 0.6% |
High ratings are table stakes, not a differentiator. 46% of pubs score the maximum 13. If you are a first-time customer choosing between three pubs on Google Maps, all three showing 4.3, 4.5, and 4.4 stars, the ratings give you almost no useful information. You are effectively choosing blind on the rating metric.
What actually differentiates pubs in search
Because reputation scores are compressed at the top, the real differentiators are everything else: review volume (which determines search prominence), presence (which determines whether the pub appears across multiple platforms), and active engagement (which signals to both Google and customers that the pub is alive and active).
Reputation is the strongest pillar at 79.5% of max: most pubs have decent Google ratings, they just don't have enough of them. That sentence contains the key insight. High ratings are abundant. High ratings combined with high volume are rare. High ratings combined with high volume, active social presence, and regular content creation are rarer still.
A pub that earns a 4.6-star average from 800 reviews, posts three times a week on Instagram, and has a well-maintained website with fresh content is not meaningfully better-rated than a pub with a 4.4-star average from 40 reviews, no social activity, and a website last updated in 2021. But it is vastly more visible, vastly more trusted, and vastly more likely to capture a customer's booking or casual visit.
The reputation finding, in other words, tells brewery marketing directors something important: stop congratulating yourselves on the four-star ratings. They are universal. The battle is elsewhere.

Finding 4: The Social Presence Cliff
Why 80% of pubs score exactly the same number on presence
The presence pillar measures how many active digital profiles a pub maintains: a Google Business listing, a Facebook page, an Instagram account, a website, and so on. And the distribution of presence scores is one of the most revealing things in this entire dataset.
80.9% of pubs score exactly 10 on presence.
Not approximately 10. Exactly 10. From 23 different estates, across England, Wales, and the Isle of Man, covering hundreds of individual publicans and landlords, eight out of ten pubs have made the same digital footprint decisions and arrived at the same score.
This is not a coincidence. It is a policy outcome.
The cliff face
The presence distribution looks like this:
| Presence Score | Count | % |
|---|---|---|
| 13 (full suite) | 7 | 0.8% |
| 10 (standard set) | 715 | 80.9% |
| 7 (partial) | 142 | 16.1% |
| 4 (minimal) | 16 | 1.8% |
| 3 (almost none) | 4 | 0.5% |
There is a clear cliff: 81% at score 10, then a steep drop to 16% at score 7, then almost nothing below. A score of 10 in our rubric represents a pub with a Google Business listing, a Facebook page, and an Instagram account, the standard trinity of pub digital presence.
A score of 7 represents a pub missing one of those, or present but with a very thin profile. A score of 13 represents a pub with the full suite: Google, Facebook, Instagram, a dedicated website, and likely additional platforms.
Only 7 pubs (0.8%) score 13 on presence: a full suite of social profiles. All 7 are from Harvey's Brewery.
This is a policy problem, not a performance problem
The 80.9% score-10 cluster is too uniform to reflect individual landlord decisions. It reflects estate policy: either explicit guidance about which platforms pubs should maintain, or the tacit understanding among tenants that Google, Facebook, and Instagram are the expected minimum. Almost every estate has landed in roughly the same place.
What no estate has done (except Harvey's, partially) is push beyond the standard set. The 0.8% scoring 13 on presence confirms that building a genuinely comprehensive digital footprint across an estate remains vanishingly rare.
This has a direct competitive implication. If every pub in your competitive set scores 10 on presence, presence is not a differentiating factor. It is baseline hygiene. The estate that systematically moves its pubs from 10 to 13 on presence will gain a structural advantage that competitors have not yet recognised as contested ground.
The 16% scoring 7 on presence also deserve attention. These are the pubs that haven't managed the standard minimum: missing a key profile or maintaining one so poorly it barely counts. For these pubs, closing the gap to 10 is not a strategic priority; it is a defensive necessity.
20 pubs (2.3%) score 4 or below on presence: they barely exist on social media at all. These are the pubs at genuine risk of being invisible to digital-native customers.
Finding 5: The Engagement and Content Desert
Where the industry fails most completely
If the presence finding is about whether pubs exist on social media, the engagement and content findings are about whether they do anything once they are there.
The answer, across 884 pubs, is: almost never.
The average pub scores 3 out of 15 on Engagement: most haven't posted on social media in weeks or months. Content scores average 3.07 out of 15, confirming that virtually no estate pubs maintain a blog or publish regular updates.
As a percentage of the possible maximum, these are the two lowest-scoring pillars in the entire dataset:
| Pillar | Avg Score | % of Max |
|---|---|---|
| Reputation | 11.93/15 | 79.5% |
| Volume | 10.68/15 | 71.2% |
| Presence | 9.40/15 | 62.7% |
| Website | 9.01/15 | 60.1% |
| Responsive | 6.14/15 | 40.9% |
| Content | 3.07/15 | 20.5% |
| Engagement | 3.02/15 | 20.1% |
Engagement and Content both sit at approximately 20% of their maximum, less than a third of the next weakest pillar (Responsive, at 40.9%). The gap is not marginal. It is structural. There is a two-tier pattern across the entire industry: pubs manage passive presence (reputation, profiles, websites) but fail at active engagement (posting, content).
The shopfront metaphor
Pubs have set up their digital shopfront but locked the door. They exist online but are effectively silent. A pub with a Google Business listing, a Facebook page with 340 followers, and an Instagram account is, in digital terms, a shopfront with no window display, no opening hours sign, and no indication that anyone is home. The infrastructure is there. The activity is not.
This matters for two reasons beyond the obvious.
The first is algorithmic. Both Google and Facebook penalise inactivity. A Facebook page that hasn't posted in 90 days is deprioritised in feeds. A Google Business profile without regular posts and updated information loses prominence over time. The infrastructure investment (creating the accounts, building the initial follower base) decays if it is not maintained. Inactivity is not neutral. It is a slow erosion.
The second reason is human. A customer checking a pub's Instagram before deciding whether to visit and finding the last post is from eleven months ago draws a conclusion. That conclusion is not "this pub is busy and doesn't need social media." It is "this pub is quiet, possibly closed, possibly not worth the trip." Social media silence signals absence, not character.
The 80/20 of pub digital health
This is where the report's title earns its place.
The gap between passive presence (68.4% of max) and active engagement (20.3% of max) is the single biggest opportunity in pub digital marketing. If the seven pillars were all performing at their passive-presence average, the industry's average score would be 71.8 out of 100, firmly Band B.
The 19-point gap between where the industry is and where it would be if engagement and content matched the passive pillars is almost entirely attributable to those two bottom-scoring categories.
This is the 80/20 of pub digital health: 80% of the problem comes from just 2 of the 7 pillars (Engagement and Content).
The practical implication is significant. Estate marketing directors looking for the highest-leverage digital investment should not be debating whether to redesign websites or invest in SEO audits. They should be asking a simpler question: are our pubs posting regularly? The answer, in 884 cases out of 884, is no, or not nearly enough.
Finding 6: Geography Is Not Destiny (But It Helps)
Regional variation exists, but it does not explain much
The 23 estates in our dataset span most of England and Wales, from Shepherd Neame's heartland in Kent to Felinfoel's in West Wales, from Okell's on the Isle of Man to Adnams in coastal Suffolk. Regional clustering data allows us to ask whether geography plays a meaningful role in digital health.
The short answer: it plays some role, but not a determining one.
| Region | Estates | Pubs Audited | Avg Score |
|---|---|---|---|
| East England | Adnams | 42 | 56.2 |
| South West | Liberation/Butcombe, Hall & Woodhouse, Palmers, St Austell | 175 | 55.2 |
| Yorkshire | Timothy Taylor, Theakston | 32 | 54.5 |
| Central South | Hook Norton, Wadworth, Arkell's | 112 | 54.0 |
| Midlands | Everards, Donnington, Batemans | 77 | 53.5 |
| NW England | Robinsons, JW Lees, Joseph Holt, Thwaites, Hydes | 223 | 53.0 |
| SE England | Shepherd Neame, McMullen's, Harvey's | 144 | 51.5 |
| Wales | Felinfoel | 50 | 51.7 |
| Island | Okell's | 29 | 46.6 |
Regional variation is modest: only 9.6 points separate the best region (East England, 56.2) from the worst (Island, 46.6). The problem is national, not regional. This is an important clarification for any estate that might be tempted to attribute its digital underperformance to its market geography.
There is no evidence in this data that being in the South West, or the North West, or rural Wales confers a meaningful structural disadvantage on digital health. The underperformance is everywhere.
The North West paradox
The North West has the most audited pubs in our dataset (223) but sits mid-table at 53.0. Five estates call the North West home: Robinsons, JW Lees, Joseph Holt, Thwaites, and Hydes. Their performance ranges from Robinsons at 56.0 (tied second overall) to Hydes at 50.2 (21st). Scale, market density, and regional proximity do not create a rising tide here. Each estate's performance reflects its own digital strategy choices, not its location.
The South West leads regionally at 55.2 average, pulled up by Liberation/Butcombe and Hall & Woodhouse. But even at 55.2, the region is solidly Band C. Leading the field in this dataset is a relative distinction.
The island effect
The Isle of Man (Okell's) is the weakest region at 46.6, reflecting geographic isolation and a smaller market. Okell's is an interesting case precisely because its geographic insularity might seem like a mitigating factor. In practice, it reflects the challenges facing a small estate without the competitive pressure or marketing infrastructure investment of mainland operators.
But the Isle of Man's pub-goers use Google, Facebook, and Instagram at the same rate as mainland customers. Digital isolation is not a geographical phenomenon.
SE England is dragged down by Harvey's outlier performance (42.9 avg), despite Shepherd Neame scoring 56.0 and McMullen's 54.5. Harvey's statistical weight pulls the regional average well below what Shepherd Neame's strong performance would otherwise suggest. This is a reminder that regional averages can conceal significant intra-regional variation.
The core finding on geography stands: this is a national problem with national causes, and it will require national-level estate thinking to resolve.
What This Means for Brewery Marketing Directors
The competitive landscape has a gap in it, and it is enormous
The findings above paint a specific picture. Almost every estate pub in Britain is performing at roughly the same mediocre digital level. The gap between the best estate and the worst is 13.3 points. The gap between Band C (where 93% of pubs sit) and Band A (which zero pubs have reached) is up to 52 points. That gap represents uncontested ground.
Here is the strategic read on what this data means for the marketing director sitting in a brewery boardroom in 2026.
(a) The bar for competitive separation is low
In most industries, a competitor who wants to differentiate on digital marketing faces well-resourced opponents who have been investing for years. They are fighting for marginal gains against established players.
In the UK brewery estate sector, that is not the situation. The industry is so uniformly mediocre that even small improvements create competitive separation. An estate that moves its average score from 53 to 65 (still well below what any ambitious brand manager would consider exceptional) would sit above every other estate in our entire dataset. Not at the top of a competitive field. As a category apart.
This is the opportunity. It will not exist permanently. But right now, in April 2026, the bar for being the digitally best-in-class brewery estate in the UK is remarkably, almost embarrassingly, low.
(b) The quickest wins are in the worst pillars
Both Engagement and Content average around 20% of their maximum. These are also, structurally, the cheapest pillars to improve. Improving Reputation requires either improving the actual pub experience or systematically soliciting more reviews from satisfied customers. Improving Volume requires time and consistency. Improving Website and Responsive requires web development investment.
Improving Engagement requires one thing: posting. Regularly, consistently, with content that reflects the pub's character and offer. This does not require a marketing agency. It does not require expensive software. It requires someone with a phone and a plan.
The same is true of Content. A pub that publishes a menu update, a seasonal events page, and a brief news post once a month is doing dramatically more than the industry average, which is, in effect, nothing.
For brewery marketing directors, this is the most actionable finding in the report. The social presence cliff explained is real, but the engagement desert is deeper. Address the engagement desert first, and address it estate-wide.
(c) Estate-wide policy changes move scores faster than individual pub efforts
The presence finding (where 80.9% of pubs score exactly 10) demonstrates clearly that estate policy shapes digital outcomes more powerfully than individual landlord initiative. When a policy exists, compliance is high. When a policy is silent on a topic, individual variation fills the gap, and that variation, as Harvey's 14.2 standard deviation shows, produces wildly inconsistent results.
An estate that decides it wants its pubs posting three times a week on Instagram, and supports that decision with a content calendar, a photographer visiting each pub quarterly, and a simple brief, will produce better collective digital outcomes than an estate that leaves it to each landlord to find their own way.
The variance data across estates strongly suggests that estates with lower standard deviations (like Adnams at 3.6 and Shepherd Neame at 3.7) have applied a consistent centralised strategy, even if that strategy is currently producing Band C results.
The infrastructure for consistency already exists. It needs to be aimed higher.
See also our estate digital strategy guide for more on this framework.
(d) The first brewery to systematically address this wins lasting advantage
Search rankings, review volume, and social following all have compounding dynamics. A pub that accumulates 500 Google reviews this year will be easier to find next year, will attract more reviews, and will pull further ahead of competitors. The advantages compound over time.
Conversely, a pub that does nothing this year will not simply stay in the same relative position. It will fall behind competitors who are building while it is standing still.
The first brewery estate to implement a systematic digital programme (coordinated content, review generation across the estate, updated profiles, mobile-optimised websites) will build a lead that becomes progressively harder to close. The second and third breweries to implement similar programmes will find the gap harder to close than the first would have found it to open.
For a reference point on the wider pub changeover context, including the competitive landscape facing new and independent operators, see our research on pubs changing hands.
The Estate-by-Estate Benchmark Table
Full rankings with band distribution
The table below provides the complete ranking for all 23 estates, with band distribution showing exactly how each estate's pubs fall across the scoring bands. The data is ordered by average score, highest to lowest.
| Rank | Estate | Region | Total Estate Pubs | Pubs Audited | Avg Score | Band Distribution (B/C/D/F) | Std Dev |
|---|---|---|---|---|---|---|---|
| 1 | Adnams | Suffolk & East Anglia | 70 | 42 | 56.2 | 0B/42C/0D/0F | 3.6 |
| 2 | Robinsons | Cheshire, Manchester, Derbyshire & N Wales | 250 | 50 | 56.0 | 0B/50C/0D/0F | 4.2 |
| 3 | Shepherd Neame | Kent & South East England | 320 | 50 | 56.0 | 0B/50C/0D/0F | 3.7 |
| 4 | Hook Norton | Oxfordshire & Cotswolds | 50 | 31 | 55.9 | 0B/30C/1D/0F | 5.1 |
| 5 | Liberation / Butcombe | South West England & Channel Islands | 80 | 50 | 55.7 | 0B/49C/0D/1F | 6.6 |
| 6 | Everards | East Midlands & Leicestershire | 170 | 22 | 55.6 | 0B/21C/1D/0F | 5.8 |
| 7 | Hall & Woodhouse | Dorset, Hampshire, Wiltshire & Surrey | 200 | 50 | 55.5 | 0B/48C/2D/0F | 4.3 |
| 8 | Donnington | Gloucestershire & Cotswolds | 15 | 20 | 55.1 | 0B/18C/2D/0F | 7.3 |
| 9 | Palmers | Dorset & West Country | 55 | 38 | 54.8 | 0B/37C/0D/1F | 6.7 |
| 10 | Timothy Taylor | West Yorkshire | 20 | 29 | 54.7 | 0B/29C/0D/0F | 4.6 |
| 11 | McMullen's | Hertfordshire & North London | 100 | 50 | 54.5 | 0B/47C/3D/0F | 5.7 |
| 12 | Wadworth | Wiltshire, Oxfordshire & Hampshire | 130 | 50 | 54.5 | 0B/49C/1D/0F | 4.9 |
| 13 | St Austell | Cornwall, Devon, Somerset & South Wales | 175 | 37 | 54.3 | 0B/37C/0D/0F | 5.1 |
| 14 | Theakston | North Yorkshire | 15 | 3 | 52.7 | 0B/3C/0D/0F | 2.4 |
| 15 | JW Lees | Manchester & Lancashire | 150 | 50 | 52.6 | 0B/48C/2D/0F | 6.3 |
| 16 | Joseph Holt | Greater Manchester | 125 | 40 | 52.5 | 0B/40C/0D/0F | 4.8 |
| 17 | Thwaites | Lancashire & North West England | 250 | 50 | 52.5 | 0B/46C/3D/1F | 7.9 |
| 18 | Felinfoel | West Wales | 80 | 50 | 51.7 | 0B/46C/4D/0F | 6.4 |
| 19 | Arkell's | Swindon, Wiltshire & Gloucestershire | 100 | 31 | 51.3 | 0B/28C/2D/1F | 9.8 |
| 20 | Batemans | Lincolnshire & East Midlands | 60 | 35 | 51.3 | 0B/34C/1D/0F | 5.9 |
| 21 | Hydes | Manchester, Salford & Cheshire | 60 | 33 | 50.2 | 0B/30C/2D/1F | 8.5 |
| 22 | Okell's | Isle of Man | 20 | 29 | 46.6 | 0B/25C/4D/0F | 7.3 |
| 23 | Harvey's | Sussex, Kent, Surrey & London | 44 | 44 | 42.9 | 7B/17C/20D/0F | 14.2 |
Reading the table
Several estates merit specific commentary.
The top cluster (Adnams, Robinsons, Shepherd Neame, Hook Norton) are all tightly grouped between 55.7 and 56.2, with low standard deviations. This is consistent, centralised management producing consistent, mid-Band C results. These estates are not failing. They are also not close to Band B. Their consistency is an asset waiting to be redirected. The Harvey's anomaly warrants its own paragraph. Harvey's Brewery is a tale of two estates: 7 pubs that would rank among the best in any estate, and 20 that rank among the worst. Its standard deviation of 14.2 is three times the industry average, because it is the only estate with pubs spanning Bands B, C, and D.Harvey's is the only estate where individual landlords appear to be running their own digital marketing, creating massive variance. This is both a risk (the 20 Band D pubs) and a proof of concept (the 7 Band B pubs, including the highest-scoring pub in the entire dataset).
Arkell's (std dev 9.8) and Hydes (std dev 8.5) show high internal variance suggesting uneven individual landlord effort rather than a consistent estate policy. Some pubs are doing meaningful digital work; others are barely present. Theakston is noted separately: only 3 pubs were audited, making it the smallest sample in the dataset and its ranking (14th, average 52.7) should be treated with caution given that sample size.How We Score
Methodology note
Our scoring system uses seven pillars (six scored out of 15 and Content Quality out of 10), giving a total maximum of 100 points per pub. The bands are designed to reflect meaningfully different states of digital health, not to create an artificial bell curve.
The seven pillars: Reputation (0-15): Based on Google star rating. A 4.5+ rating scores 13; 4.0-4.4 scores 10-12; below 4.0 scores lower. Very high or very low review counts affect score reliability. Volume (0-15, but max attainable is 13): Based on total number of Google reviews. The scoring tiers are: 100+ reviews (13 points), 50-99 (10 points), 20-49 (7 points), 10-19 (5 points), 1-9 (1-4 points), zero reviews (0 points). Scores 14 and 15 are not attainable under the current rubric; maximum is 13. Presence (0-15): Based on the number of active digital profiles maintained: Google Business, Facebook, Instagram, dedicated website, and additional platforms. A complete suite scores 13; the standard Google-plus-social-profiles scores 10; missing key platforms scores 7 or below. Engagement (0-15): Based on posting frequency. Regular weekly posting scores towards the top; monthly posting scores mid-range; posting less than monthly or not at all scores 0-3. Website (0-15): Based on website quality, completeness, loading speed, and up-to-date information including menus and opening hours. Responsive (0-15): Based on mobile-optimisation. A properly responsive site that renders cleanly on smartphones scores well; a desktop-only or poorly adapted site scores low. Content (0-15): Based on whether the pub publishes regular written content: blog posts, news updates, seasonal information, or editorial content. Very few estate pubs do this; it is currently the clearest differentiator between Band C and Band B. Data sources: All data collected from publicly available sources including Google Search, Google Maps, Facebook, Instagram, and pub websites. Data collected between January and April 2026. Caveats: Theakston (3 pubs audited) has too small a sample for reliable ranking. Timothy Taylor (29 pubs audited vs 20 in estate records) and Donnington (20 audited vs 15 in records) may include some non-tied houses. Okell's (29 audited vs 20 in records) captures a broader slice of the Isle of Man pub scene. A note on bands: Band A (80-100) requires a pub to perform consistently well across all seven pillars. No pub in our dataset achieved this. Band B (60-79) requires strong performance across most pillars, with active engagement and content creation. Only 7 pubs achieved this. The scale is not broken. The bar is simply higher than the industry has so far cleared.Full methodology documentation and pillar-by-pillar breakdowns are available in the individual estate reports, linked throughout this article and in the table below.
View Your Estate Report
We have already audited your estate. Every pub has been scored. Every pillar has been measured. The results are waiting for you.
If you are a brewery marketing director, head of estates, or trade journalist who wants the full picture for a specific estate, click through to the individual report pages below. Each report includes pillar-by-pillar averages, individual pub scores, band distribution charts, and specific recommendations.
| Estate | Report |
|---|---|
| Adnams | View report |
| Arkell's Brewery | View report |
| Batemans Brewery | View report |
| Donnington Brewery | View report |
| Everards Brewery | View report |
| Felinfoel Brewery | View report |
| Hall & Woodhouse | View report |
| Harvey's Brewery | View report |
| Hook Norton Brewery | View report |
| Hydes Brewery | View report |
| Joseph Holt | View report |
| JW Lees | View report |
| Liberation / Butcombe | View report |
| McMullen's | View report |
| Okell's Brewery | View report |
| Palmers Brewery | View report |
| Robinsons Brewery | View report |
| Shepherd Neame | View report |
| St Austell Brewery | View report |
| Theakston | View report |
| Thwaites | View report |
| Timothy Taylor | View report |
| Wadworth | View report |
The findings in this report are a starting point, not a verdict. The data shows where the industry is today. What happens next is a choice.
Want to test whether the data translates into results? Our 5-pub pilot programme lets you prove the model on a small scale before committing to the estate.
If you are a brewery marketing director who wants to understand what a systematic digital improvement programme for your estate would look like in practice, we are happy to talk. We have done the audit. We understand the data. We know which levers move which scores. Get in touch at pubpostpro.co.uk or email us directly.
Alternatively, see our guide to Google reviews for pubs as a starting point for the highest-leverage single action most estates could take this quarter.
Tom Fairhall is the founder of Pub Post Pro, a data-led social media and digital presence service for independent pubs and brewery estates across the UK.